Many eyes are on the McKelvey recession indicator. Too many? That would probably be the case if everyone believed it.
What is the McKelvey Recession Indicator?
Take the current value of the 3-month unemployment rate average, subtract the 12-month low, and if the difference is 0.30 percentage point or more, then a recession has started.
Edward McKelvey, a senior economist at Goldman Sachs, created the indicator. The problem with the indicator is that it has many false positives.
Claudi Sahm Modification
Claudi Samn, a former Fed economist, revised the rule, claiming it as her own, without credit to McKelvey, then set the indicator to 0.50.
Because that still had false positives, she started her series in 1960.
McKelvey Improvements
Improvements to the model by Pascal Michaillat and Emmanuel Saez, economists at the University of California in Santa Cruz, eliminate all false negatives and all false positive dating to 1951.
I referred to their improvement as PMES based on their initials. I am not sure that PMES is right but somehow I don’t think the name McKelvey-Michaillat-Saez will catch on.
Please see Key Recession Indicator Gives Stronger Recession Signal in August for discussion of the Pascal Michaillat and Emmanuel Saez PMES improvements.
PMES Update
On Friday, following the BLS jobs report, Pascal updated the indicator : Has the Recession Started?
He says “With August 2024 data, our indicator is at 0.54 percentage points, so the probability that the US economy is now in recession is 48 percent. In fact, the recession may have started as early as April 2024.”
I calculate 0.54 independently, but in my post I said “I will take the over line on 48 percent odds.“
On Saturday, I had an Email exchange with Pascal on calculating the odds. It started with an observation of Pascal that struck me as wrong.
Pascal: “When the indicator is below 0.3 percentage points (pp), a recession has not started. When the indicator is above 0.8pp, a recession has started for sure. When the indicator is in the 0.3pp–0.8pp band, a recession is likely to have started.”
Mish Note: At the time I emailed Pascal, I did not have a suggested alternative, but I have one now, described below. First, consider the email exchange.
Email Exchange Mish to Pascal
Hi Pascal, I believe your probability calculation is wrong.
Your statement “When the indicator is below 0.3 percentage points, a recession has not started,” is observably false.
Here is a table of actual conditions when recession started.
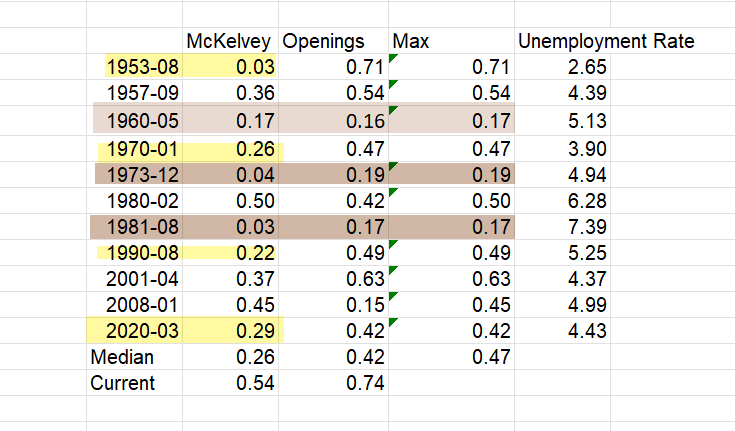
Three out of 11 recessions started with both McKelvey and PMES below 0.1!
The likelihood may be small but it is nonzero and happened 3 times.
In general, any time both indicators are nonzero, there is a nonzero chance.
Also note 8 of 11 recessions started with McKelvey below 0.3.
The area approach >.3 and
I think the scale should be a log scale. 1960, 1973, and 1981 are especially problematic for your area rule.
We have eliminated the false negatives and false positives, but I think we need work on probabilities. By the time both indicators are >0.5 I am pretty sure the odds are greater than 48%.
Think of a Richter Scale with earthquakes. I suggest the odds of damage (recession) increases in a non-linear fashion as both indicators get above a certain level.
The medians values are 0.26 and 0.42 in isolation. And those are long ago in the rearview mirror simultaneously.
Pascal Email Response
Hi Mish, Thank you very much for your note.
So far we use a linear probability by lack of anything better. But I agree with your intuition that it might better to use a nonlinear probability.
We will think about it, and I will of course keep you updated. I have a lot of work this month, so this will probably have to wait a few weeks.
Mish Note: Following that response I came up with the idea on how to do this.
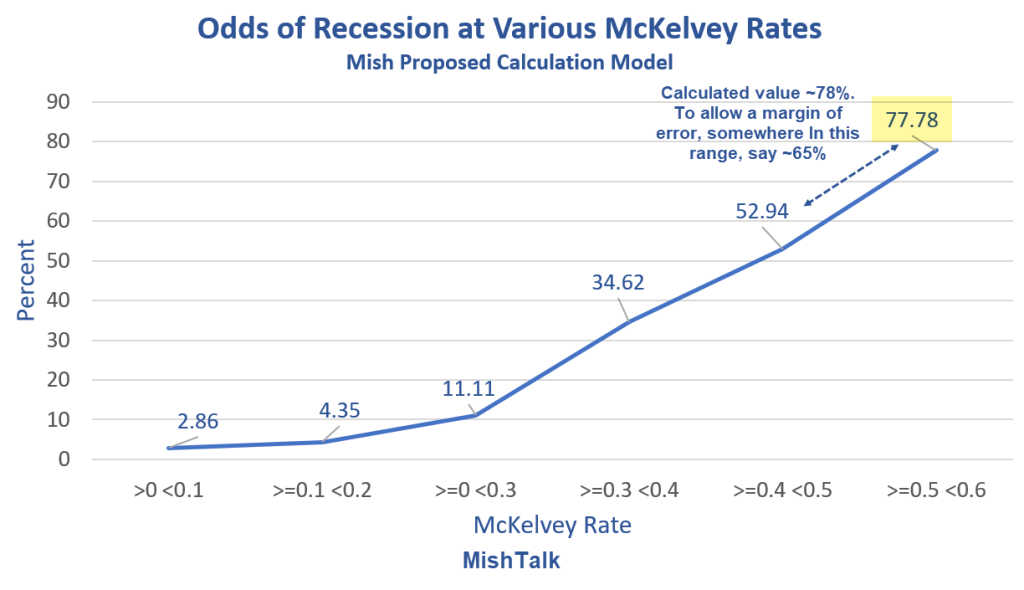
How I Calculated the Odds
- Count all the occurrences of a McKelvey indicator >0 but
- Do the same for every range in increments of 0.1 percentage points.
- Repeat steps 1-2 calculating a 0 or 1 value if the economy was in recession.
- Divide the counts of steps 3 by the results of steps 1-2.
Results
- >0
- >=0.1
- >=0.2
- >=0.3
- >=0.4
- >=0.5
- =0.6
- =0.7
The last two lines are counterintuitive. But the cause is very elevated McKelvey indicators after recession has ended.
For example, following the end of the 1957 recession, there were 9 consecutive months in which McKelvey indicator was above 0.7 but there was no recession. Five of those numbers were above 3.0.
This implies the odds in my chart may be a bit low as numbers get higher.
There are a few ways to fix this. One way is to discard all results for x number of months following recession. Alternatively, and likely better, discard all results following recessions until the signal resets at a McKelvey reading of
A simpler way is lop off the lead chart where I did and call it a bargain on the basis we are dealing with imprecise BLS data to say the least.
I had previously suggested using 0.4 percent as a trigger and the above calcs suggest 0.4 is very near the 50-50 tipping point.
Bear in mind, even with the PMES modification, the combined indicator is still lagging (trails the actual start of recessions). This explains the three recessions that start with both McKelvey and PMES below 0.1.
Getting rid of false signals created a problem in calculating the odds. I believe my method or something close is the solution.
Finally, please note that my calculated odds do not factor in the second indicator. The addition of the second indicator logically increases the odds above what I came up with.
Where Are We Now?
I have McKelvey at 0.54 and a confirming PMES of 0.74.
This is suggests a recession probability of ~77.78 percent. Those who seek a margin of error, perhaps based on the idea of imprecise BLS data, might look at overlapping ranges.
If so, I suggest a range of ~53 to ~78 percent, say ~65 percent vs the Pascal calculation of 48 percent.
The key idea is recession probabilities are a non-linear function of rising recession indicators.
Pascal said that recession may have started in April. In April, I have McKelvey at 0.34. That puts the odds at 35 percent straight up.
It would take some huge (but possible) negative BEA revisions to get there. June or July looks more likely on the basis of this analysis.
My Recession Rule Was Meant to Be Broken
One of the more amusing things is Sahm believes the indicator she popularized (but did not invent) is now giving a false signal.
Bloomberg reports My Recession Rule Was Meant to Be Broken
Sahm: While the economy is growing less quickly, it is growing. There is no recession, at least not yet.
But conditions can change quickly, and by the time the NBER has officially designated a recession, it is usually too late to guide policymakers. The purpose of the Sahm rule is to act as a kind of early diagnosis. I created it in early 2019 to shorten the wait time on the NBER and act as an automatic trigger for fiscal policy, such as stimulus checks, in a downturn.
Sahm did not create the indicator, she modified an indicator created by Ed McKelvey, without credit, (perhaps inaccurately, resulting in strange negative numbers). My calcs have no negative numbers nor do PMES calcs.
The idea of “automatic stimulus checks” is just plain ridiculous. We are in this mess because of stimulus checks.
Fed and Congressional over- and underreactions have created boom-bust cycles of increasing amplitude over time.
Too Many Eyes?
Many eyes are on the McKelvey recession indicator. Too many?
That would probably be the case if everyone believed it. In this case, heck, not even Sahm believes it.
Supporting Factors
September 3: Construction Spending Growth Slows in May, Stops in June, Negative in July
September 6: Payroll Report: Manufacturing Sheds 24,000 Jobs, Government Adds 24,000, Big Negative Revisions
September 7: BLS Negative Job Revisions 15 of Last 21 Months
September 9: Fed Beige Book Conditions Are Worse Now Than the Start of the Great Recession